This article is based on ideas originally published by VoxEU – Centre for Economic Policy Research (CEPR) and has been independently rewritten and extended by The Economy editorial team. While inspired by the original analysis, the content presented here reflects a broader interpretation and additional commentary. The views expressed do not necessarily represent those of VoxEU or CEPR.
Over the past three months, US employers added an average of just 35,000 jobs—a sharp slowdown from roughly 128,000 in the prior three months—while a combined 258,000 jobs were revised down in May and June payrolls. At the same time, the unemployment rate held near 4.2%, quits slid to 2.0%, and job openings hovered at 7.4 million, leaving 0.9 unemployed workers per vacancy. Read in isolation, none of those prints screams “recession.” Read together, their shape does. The vacancy–unemployment point has drifted toward the interior of the Beveridge curve; services-sector hiring indexes have slipped into contraction; and temporary help employment has shed 655,000 jobs since its 2022 peak. These aren’t one-off alarms; they’re the outline of a turning cycle—geometry, not gossip. In a year when “large revisions and politics cooled hot” headlines, the disciplined way to separate signal from noise is to treat the labor market as a function with a contour, not a thermometer with a number. The shape is telling us something policymakers in education and work need to hear now.

Reframing the Question: From Output Levels to the Shape of Matching
Macroeconomic conversations still default to Y = f(L, K)—output as a function of labor and capital—with labor tightness proxied by unemployment alone. That framing misses the heart of early-cycle dynamics: the form of the matching function itself. When unemployment (U) and vacancies (V) move together along a stable Beveridge curve, modest fluctuations in either tell us little about turning points. When the geometry changes—when the U–V point migrates inward or outward, or when quits, hours, and temporary hiring bend away from past isoquants—we learn far more, far earlier, about recession risk. Recent research formalizes this intuition with recession classifiers that use both unemployment and vacancies to filter noise, and related work shows a stable “full-employment” unemployment rate u* ≈ √(u·v). With July’s u ≈ 4.2% and June’s JOLTS vacancy rate ≈ 4.4%, u* sits near 4.3%, implying slack has crept back toward the economy’s steady-state frontier even before headline unemployment breaks higher. For educators and administrators planning enrollment, staffing, and program mix on 6- to 24-month cycles, this reframing matters more than ever: it turns a lagging alarm into an anticipatory map.
Method, Not Mystery: A Transparent Shape-Based Read of Today’s Labor Market
The goal is early, accurate classification—not clairvoyance—so the method must be simple, observable, and replicable. Start with the U–V plane. Using the Bureau of Labor Statistics (BLS) June JOLTS release, job openings stood at 7.4 million (rate 4.4%); the unemployment rate in July was 4.2%. The unemployed-per-opening ratio sits at 0.9. We compute V/U ≈ 1 / 0.9 ≈ 1.11 and locate the point on the Beveridge curve relative to 2021–2023 data, when V/U peaked above 1.8. Second, layer in flows that summarize worker and firm behavior: quits at 2.0% (down nearly a whole point from the 2021–2022 peak), layoffs steady near 1.0%, and hires 3.3%. Third, add intensive-margin indicators: average weekly hours 34.3 (flat on the year), temporary help down 20.6% since its March 2022 high, and part-time for economic reasons rising on trend to 4.68 million. Finally, cross-validate with survey-based demand proxies: ISM Services employment at 46.4 (contraction) and Manufacturing employment near the low-40s. This composite “shape profile”—one position on U–V plus coherent bends in quits, temps, PTER, and hiring PMIs—yields an interpretable signal: demand is cooling through reduced recruiting and churn, not a spike in layoffs, a pattern that often precedes broader softness by one to three quarters. Where data are noisy or revised, the method uses ratios and multi-series agreement to avoid over-reacting to any single print.
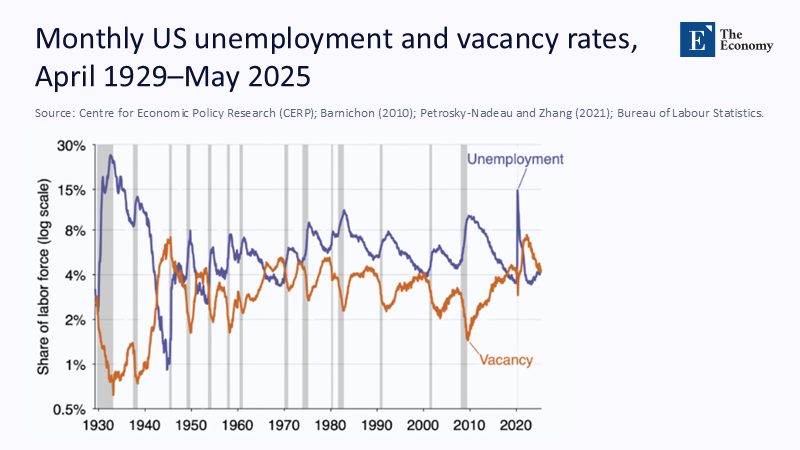 Figure 1: Unemployment and vacancies move in distinct cycles; downturns align with inward pivots—evidence that shape, not one rate, flags turns.
What the ABCs Are Saying: Beyond the “Hot” Headline
Through much of the year, headline payrolls implied a still-hot labor market. Then the revisions landed. May and June were marked down by 258,000—a reminder that initial prints are estimates, not verdicts. Meanwhile, ABC’s synthesis of expert commentary points to three overlapping drags that shift the composition of labor demand even when top-line unemployment is steady: tariff uncertainty, restrictive immigration policy, and federal job cuts. Tariffs have elevated the average effective rate to 18.3%, raising input costs and freezing expansions. A new policy brief finds the foreign-born labor force down 1.7 million since March, reshaping local matching and wage bargaining. And the federal sector has shed tens of thousands of jobs since January, subtracting a steady source of middle-skill openings in many regions. Read together, these forces flatten vacancy creation, depress quits, and nudge the U–V point inward—clear shape changes that are hard to see if attention stays on the unemployment rate alone.
Composition Is a Barometer: Gender, Immigration, and the Added-Worker Myth
The old aphorism—“rising female labor force participation signals recession”—came from mid-century observations of the added-worker effect. Contemporary evidence shows the effect exists, but its aggregate contribution is limited: one recent study estimates only 1.5%–3.5% of married women entering the labor force in a given month are “added workers,” even though the likelihood a married woman enters jumps by about 60% when her spouse loses a job. Data since 2023 tell a different macro story: prime-age women’s participation rose to record or near-record highs (≈ 77.7% in mid-2025), reflecting childcare access, telework, and sectoral mix, not a recessionary scramble for income. This kind of composition read is essential: when immigrant participation falls (documented above), but prime-age women’s participation stays elevated, the net effect on matching, wages, and training demand differs markedly from past recessions. Institutions that track who is moving—young workers, mothers, older men—gain a clearer line of sight into program design than institutions that track how many are moving.
The Data Behind “Cooling” That Matters for Campuses and Classrooms
For colleges, districts, and training providers, the order in which labor indicators deteriorate is policy-relevant. Today’s pattern—quits down, temporary help down, ISM employment weak, hours flat—lines up with a demand-led slowdown. That mix typically boosts applications for short, job-relevant programs (certificates, micro-credentials) before it raises unemployment enough to flood degree programs. In practice: expect more substantial interest in employer-aligned certificates in healthcare support, logistics, and digital operations as vacancy-to-unemployment (V/U) compresses toward 1.0, and be cautious about expanding expensive capacity in fields where openings are fading (e.g., interest-sensitive manufacturing). Funding models tied to headcount alone will lag reality; shape-sensitive triggers—such as automatic scholarships when quits fall below 2.1%, or rapid-response grants when temporary help employment declines more than 15% year over year—would stabilize access precisely when workers seek reskilling. Faculty staffing should mirror these curves: protect instructional depth in programs where V/U remains above 1—still-tight local niches—even as generic demand cools.
Anticipating the Objections—and the Evidence That Answers Them
One critique says: if the Sahm rule hasn’t triggered, why pivot policy now? Because the Sahm rule is calibrated to confirm recessions, not to anticipate them, it typically fires well after the turning point. A second critique says revisions make everything suspect. True—and that is precisely why a shape approach relies on ratios and multi-source coherence. Even after July’s unusual downward revisions, the unemployment-per-opening series is 0.9, quits are 2.0%, and ISM employment reads sub-50; those indicators are collected in separate surveys with different error structures and still tell the same story. A third critique says today’s slowdown is policy-specific (tariffs, immigration) and might fade. Perhaps—but policy shocks change composition first, and composition changes are precisely what the shape method captures. If the foreign-born labor force continues to contract, expect matching frictions to rise in childcare, eldercare, and hospitality—training and credential policy must move now, not after unemployment is up half a point.
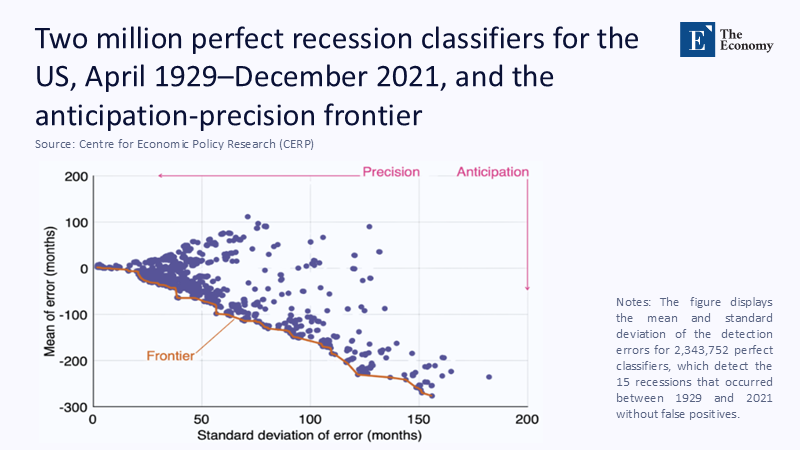 Figure 2: Anticipation–precision frontier: combining U and V can move earlier without false alarms—our method targets the high-precision edge.
A Practical Policy Upgrade: Institutionalize “Shape Literacy”
The fix is not another proprietary index. It is statutory shape literacy across education and workforce systems:
Adopt a two-variable early-warning dashboard (U and V) at the state board or system level, published monthly, with V/U and the point’s location relative to a three-year Beveridge curve. Require agencies to post a one-paragraph shape narrative explaining the month’s movement in plain English. Layer in quits, temporary help, PTER, and hours as standard corroborators. Tie automatic budget flexibilities (emergency scholarships, short-cycle program launches, adjunct pools) to those geometric triggers. Embed composition-aware planning: rising prime-age female participation with falling immigration implies more demand for allied-health certificates, early-childhood training, and flexible scheduling; falling quits with flat hours implies higher returns to placements and apprenticeships that de-risk employer hiring. Finally, publish an equity addendum: which groups are moving where, and which programs should follow them? None of this requires forecasting wizardry—only discipline in reading the picture the labor market is already drawing.
What We Learned from the “Hot” Mirage: Revisions, Reliability, and Redundancy
July’s extensive downward revisions rattled confidence and even prompted attacks on statistical agencies. They should instead prompt a more redundant measurement culture. Benchmark revisions are regular; response-rate problems are real; and political controversy is inevitable. The antidote is cross-validation: lean on multiple independent series (household and establishment data, JOLTS, ISM), emphasize ratios (U per opening, V/U), and publish confidence bands for planning scenarios. Education systems should formalize sensitivity analyses: what do enrollment, staffing, and aid look like if quits fall to 1.8% and ISM services employment stays below 50 for three months? What if V/U returns to 1.3 quickly because tariff rules stabilize? Shape-driven “if-then” planning makes policy robust against revision noise. It also depoliticizes decisions: if the curve moves to a recessionary quadrant, aid expands automatically; if it moves back, aid normalizes—no drama required.
Read the Lines, Not the Headlines
The opening observation stands: payroll counts softened, were revised down hard, and yet the unemployment rate barely budged. That mismatch is the point. A single number can lull or alarm; a shape educates. The U–V point has slid toward balance; quits have cooled to 2.0%; temporary help remains depressed; services-sector hiring has contracted. Individually, these facts are debatable signals. Together, they sketch a cycle turning through demand, not yet layoffs. The call to action is direct: make shape literacy a requirement for public workforce and education planning; tie automatic supports to geometric thresholds; and publish simple, transparent narratives each month so students, workers, and employers can navigate with the same map. The economy may or may not tip into recession this year. But if policymakers in education keep reading the geometry of work—rather than waiting for a headline to declare the downturn—they can cushion families earlier, target training better, and emerge stronger on the other side.
The original article was authored by Pascal Michaillat, a Professor of Economics at the University of California, Santa Cruz. The English version of the article, titled "Filtering labour market data optimally to detect recessions early and accurately," was published by CEPR on VoxEU.
References
Ahn, H. J., & Mustre-del-Río, J. (2025). (Re-)Connecting inflation and the labor market: A tale of a disappearing Phillips curve (FEDS 2024-050r1). Board of Governors of the Federal Reserve System.
Atlanta Fed. (2025, July 9). Wage Growth Tracker. Federal Reserve Bank of Atlanta.
Bureau of Labor Statistics. (2025, Aug. 1). Employment Situation—July 2025 (news release & tables). US Department of Labor.
Bureau of Labor Statistics. (2025, July 29). Job Openings and Labor Turnover—June 2025 (USDL-25-1198). US Department of Labor.
Bureau of Labor Statistics. (2025). Number of unemployed persons per job opening (JOLTS chart). US Department of Labor.
Conference Board. (2025, July 21). US Leading Economic Index® declines in June 2025.
Congressional Research Service. (2025, Feb. 7). BLS benchmark revisions: What they are and why they matter. US Congress (CRS External Product IF12827).
Institute for Supply Management. (2025, Aug. 5). Services ISM® Report On Business—July 2025: Services PMI® 50.1; Employment 46.4.
Institute for Supply Management. (2025, Aug. 1). Manufacturing ISM® Report On Business—July 2025: PMI® 48.0; Employment 43.4.
Michaillat, P. (2025, Aug. 1). Filtering labour market data optimally to detect recessions early and accurately. VoxEU/CEPR.
Michaillat, P., & Saez, E. (2024–2025). u = √uv*; Beveridgean unemployment gap; Has the recession started? Working papers & notes. pascalmichaillat.org.
National Foundation for American Policy. (2025, Aug.). US Labor Force Analysis for July 2025. NFAP Policy Brief.
Richmond Fed. (2025). Scavette–O’Trakoun–Sahm (SOS) recession indicator; Economic Brief EB-25-07. Federal Reserve Bank of Richmond.
St. Louis Fed (FRED). (2025). Average weekly hours of all employees, total private (AWHAETP); Part-time for economic reasons (LNS12032194); Prime-age women LFPR (LRAC25FEUSM156S); Sahm Rule (data series).
The ABC News Staff. (2025, Aug. 4). Why is the labor market slowing down? Experts explain. ABC News.
US Bureau of Labor Statistics. (2025, Aug. 1). CES Highlights: July 2025